BWG IDX offers powerful reports that can display useful information about the market and comparable property values.

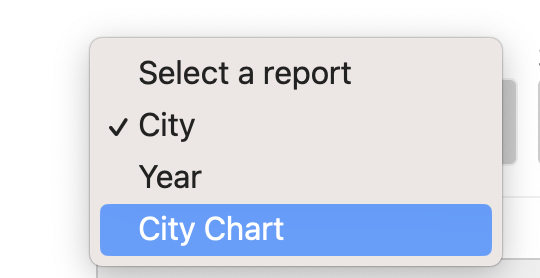
Try this dropdown to see Animated Charts
Sold Listings by City
Click row to see detail
| City | Num Sold Listings | Num Active Listings | Avg Listing Price | Avg Selling Price | Selling % of Asking | Avg Price Reduction | Avg Days on Market | Avg Price per SqFt |
|---|---|---|---|---|---|---|---|---|
| Boston | 13,470 | 3,434 | $417,648 | $410,531 | 99.8% | 0.7% | 66 | $285 |
| Cambridge | 2,030 | 464 | $455,548 | $457,680 | 99.8% | -15.5% | 57 | $293 |
| Medford | 1,004 | 137 | $437,073 | $447,355 | 99.9% | 0.6% | 60 | $268 |
| Melrose | 395 | 55 | $504,791 | $525,912 | 99.9% | 0.4% | 54 | $272 |
| Somerville | 1,463 | 321 | $443,169 | $442,666 | 99.7% | 0.9% | 60 | $270 |
| Wakefield | 380 | 47 | $450,056 | $470,335 | 99.9% | 0.5% | 57 | $268 |
| 18,742 | 743 | $451,381 | $459,080 | 99.8% | -2.1% | 59 | $276 |
LIGHTBOX-IMAGES
